
Riding the Rate Cut Rollercoaster: How the Stock Market Reacts and What Investors Should Do Now
18 Sep 2024
In the wake of the Federal Reserve lowering interest rates, the stock market’s behavior has been an area of intense focus for investors. Historically, rate cuts have had varying impacts on the market depending on the macroeconomic environment, inflation pressures, and market sentiment at the time.
Here’s what the data tells us about stock market performance after the Fed slashes interest rates — and what it might mean for investors today.
Historical Stock Market Performance After a Rate Cut
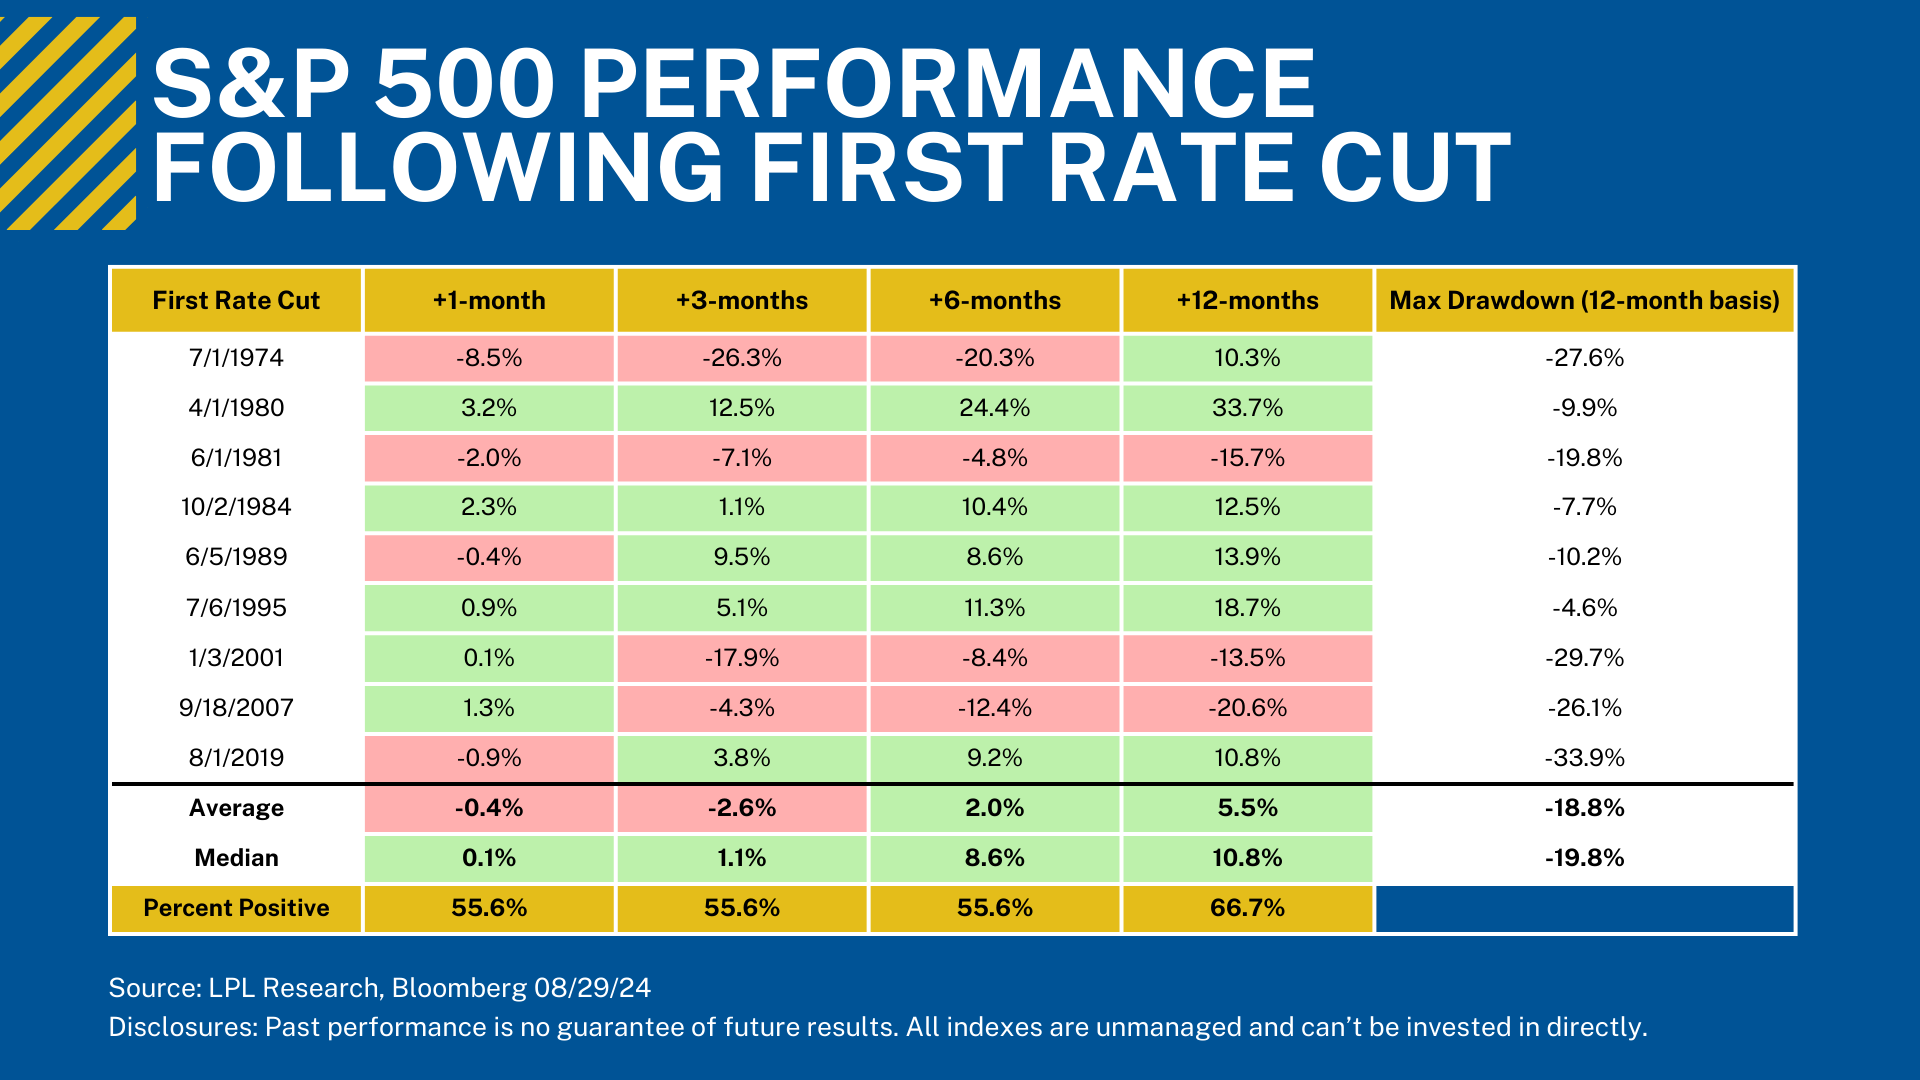 The chart breaks down the S&P 500’s performance following a first rate cut over four time horizons: 1-month, 3-months, 6-months, and 12-months. Additionally, it provides insight into the maximum drawdown, or largest peak-to-trough decline, within the first 12 months.
- Short-Term Reaction (1-3 months): The short-term performance after a rate cut is far from guaranteed. In the one-month period following a rate cut, historical data shows a near-even split between positive and negative returns, with only 55.6% of the instances resulting in gains. The average performance after one month is a slight decline of -0.4%, highlighting that investor reactions can often be cautious or uncertain in the immediate aftermath. This is reflected in cases such as 1974 and 1981, where the market fell by -8.5% and -2.0% respectively, within a month of the cut.
- 3-6 Months Outlook: Looking three months out, the picture is still mixed with the same 55.6% of instances posting positive returns. However, by six months, the market performance improves notably, averaging a 2% gain and a median return of 8.6%. Historically, the market tends to settle and gain momentum during this period, often supported by broader economic stabilization following the rate cuts. For example, in 1989 and 1995, the S&P 500 posted strong gains of 9.5% and 5.1% three months after the cuts, and those gains expanded to 8.6% and 11.3% by the six-month mark.
- Long-Term Gains (12 Months): Investors who weather the initial volatility are often rewarded. On average, 12 months after the first rate cut, the S&P 500 has posted an average gain of 5.5%, with the majority of instances (66.7%) showing positive returns. Notably, during the periods of 1980 and 1995, the market experienced gains of 33.7% and 18.7% after a year, demonstrating that rate cuts can ultimately fuel stock market growth.
- Max Drawdown Risk: Despite the positive long-term outlook, investors should be cautious of significant downside risks. The chart shows that the S&P 500 experienced an average maximum drawdown of -18.8% within 12 months following the first rate cut. This risk is especially pronounced in periods of economic distress, such as in 2001 and 2007, when the market faced drawdowns of -29.7% and -26.1% respectively. Such drawdowns suggest that rate cuts, while beneficial for long-term market performance, don’t immediately insulate markets from volatility or economic downturns.
Key Takeaways for Investors Today
- Short-Term Volatility is Normal: Historical data suggests that while a rate cut can spark optimism, the market’s short-term reaction is far from predictable. Investors should prepare for potential volatility within the first one to three months. However, remaining patient can lead to better outcomes, as the market often steadies over time.
- Economic Context Matters: Not all rate cuts are created equal. The state of the broader economy plays a crucial role in determining the market’s response. For example, cuts during periods of inflationary pressure or economic slowdown, such as in 1981 or 2007, may lead to weaker stock market performance. Conversely, rate cuts during periods of stable growth and low inflation, such as in 1995, can fuel stronger gains. Investors should assess the current macroeconomic environment and the Fed’s reasons for cutting rates before drawing conclusions.
- Focus on the Long-Term: Historically, the S&P 500 has posted positive gains one year after a rate cut in 66.7% of cases. This long-term outlook highlights the importance of staying invested and avoiding knee-jerk reactions to short-term market swings. Investors with a long time horizon should consider staying the course, as rate cuts often provide the fuel for longer-term market recoveries.
- Beware of Drawdowns: While the average one-year performance is positive, the risk of significant drawdowns remains real. With an average drawdown of nearly -19%, rate cuts don’t always shield investors from downturns in the market. Those with shorter-term needs or lower risk tolerance might consider adjusting their portfolio or employing hedging strategies to manage potential downside risk.
Final Thoughts
The Federal Reserve’s decision to cut interest rates often signals a shift in economic policy aimed at stimulating growth, but the market’s response is far from uniform. As history shows, the S&P 500’s performance after a rate cut can range from short-term declines to strong long-term gains, depending on the broader economic environment. Investors should maintain a clear understanding of their risk tolerance, time horizon, and the current economic landscape when navigating the market post-rate cut. By keeping these considerations in mind, investors can position themselves to not just survive—but thrive—in the face of uncertainty.
Important Information:
This information is not intended to be a substitute for specific individualized tax advice. We suggest that you discuss your specific tax issues with a qualified tax advisor.
Securities and advisory services offered through LPL Financial, a registered investment advisor, Member FINRA/SIPC.
The opinions voiced in this material are for general information only and are not intended to provide specific advice or recommendations for any individual.
All investing involves risk including the possible loss of principal. No strategy assures success or protects against loss.
Rebalancing a portfolio may cause investors to incur tax liabilities and/or transaction costs and does not assure a profit or protect against loss.